



Stats: China’s total polymer imports and exports rebound in Feb; PVC exports at all-time high
by Thi Huong Nguyen - thihuongnguyen@chemorbis.com
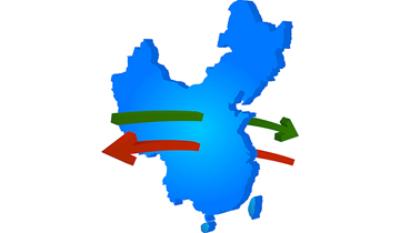
Following a slowdown in January due to the Spring Festival holiday, China’s total polymer imports and exports rebounded in February, according to ChemOrbis Stats Wizard PRO. The data also showed significant increases compared to the same period last year.
Polymer imports rose by around 10% month-on-month and 25% year-on-year. Exports followed a similar trend, increasing by more than 14% monthly and surging 43% compared to February 2024. The total import value stood at approximately $1.98 million, rising over 8% from December 2024, while export value grew nearly 12% month-on-month to reach about $1.1 million.
PP imports and exports see biggest monthly rise since Mar 2024
February saw a notable gain in China’s PP imports, which rose 16% from January and 29% from the same month of 2024. The import value was over $330,000, up by roughly 29% from last month. South Korea, Singapore, and the United Arab Emirates remained China’s leading PP suppliers.
The country’s total PP exports in February sharply increased by 39% from the previous month. When compared to February 2023, this figure indicated a surge of around 41%. PP exports were valued at nearly $250,000 in the second month of the year, rising by 31% on a monthly basis. The top destinations for Chinese-origin PP were Vietnam, Bangladesh, and Indonesia.
PE imports hit nearly 3-year high; exports also rise
In February, imports of PE, consisting of LDPE, LLDPE, HDPE, and mLLDPE, were significantly up by 10% from January and 27% from the same period last year. PE imports reached the highest volume since March 2022, while the total value stood at approximately $1.5 million, rising by 9% from last month. The top suppliers of PE were the United States, Saudi Arabia, and the United Arab Emirates.
PE exports recorded a monthly increase of 14%; however, they slightly declined by 3% in a yearly comparison. February exports totaled over $72,000, which was 7% higher than that in January. Bangladesh, the Philippines, and Vietnam were the top three main outlets for China’s PE outflow.
PVC imports further reduce; exports break all records
China’s February imports of PVC, combining emulsion-PVC (E-PVC) and suspension-PVC (S-PVC), plunged by 27% from January, marking the second straight month of decrease. They also dropped by 19% compared to February 2024. The overall import value was reported at around $20,000, with the US, Taiwan, and Japan remaining the largest suppliers.
In contrast, PVC exports had a strong uptick of 15% month over month and a dramatic rise of 98% year over year to achieve their all-time-high volume in February. PVC’s total export value increased to $219,000, up by 13% from a month earlier. China’s top export markets for PVC were India, Uzbekistan, and Vietnam.
PET bottle exports rebound by 15% monthly
The volume of PET bottle resin exports sharply climbed by 15% from December and 27% from the same period last year. Additionally, the overall export value also rose by 17% on a monthly basis, totaling $397,000.
Algeria, Iraq, and the United Arab Emirates were the top buyers of Chinese-origin PET bottles in February, followed by regular destinations in nearby Southeast Asia like Indonesia, Vietnam, and the Philippines.
PS, ABS imports and exports buck rising trend
PS and ABS imports continued to decline in February, although both showed significant year-on-year increases.
PS imports, including GPPS and HIPS, fell 2% month-on-month but rose 18% from February 2024. The total import value remained largely unchanged at $38,000, though it increased 20% year-on-year.
ABS imports dipped by 1% from January but were 23% higher year-on-year. Import value increased 2% monthly and 27% annually, reaching $101,000.
For detailed figures on tonnage and more, visit ChemOrbis Stats Wizard Pro.
More free plastics news
Plastic resin (PP, LDPE, LLDPE ,HDPE, PVC, GPS; HIPS, PET, ABS) prices, polymer market trends, and more...- Europe’s petchem plants close, assets change hands: How far has restructuring progressed?
- Suez recovery gains ground, but global shipping remains far from normal
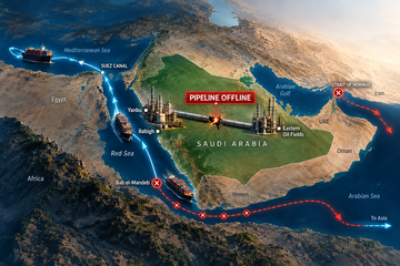
- Saudi pipeline outage compounds supply and logistics risks, fueling PP, PE rally
- S Korea’s petchem restructuring moves from talks to closures
- European natural gas, Asian LNG hit fresh highs amid Middle East tensions
- Global shipping faces persistent bottlenecks across major trade routes
- War or recovery? H1 earnings reshuffle petchem winners and losers
- Oil roller coaster in July H2 fails to derail most polymer rallies
- Dow’s €1.1 billion claim puts Europe’s ethylene cartel dispute back in focus
- Crude oil surges on renewed war premium; will it reverse the polymer slump?